Usage, Adoption & Productivity Analytics
Track AI usage, adoption, and productivity in the admin analytics tabs: request volume, weekly active users, and honestly labelled code metrics, split by project.
On this page
TL;DR: /admin/analytics is a server-rendered dashboard with tabs for Overview, Usage, and Code (plus Spend, covered in Cost Management). It answers who is using the platform, how much, and what they produce — with selectable periods from 15 minutes to 30 days, and every view filterable by project (Commerce or Core) or user.
Periods and filters
Every tab shares the same controls: period presets from 15 minutes up to 30 days, plus a custom range picker, and a Project selector (All / Commerce / Core). The project is set by an admin on the user's detail page — see User & Access Management — and an admin can narrow any page to one; a plain user only ever sees their own.
Overview and Usage tabs
The Overview and Usage tabs cover platform utilization:
- Request volume — total requests over the period, with daily and weekly series and historical trend.
- Error rate — failed requests as a share of total.
- Active users — distinct users per bucket, charted over time.
For CLI cross-checks and scripted reporting:
systemprompt analytics overview
systemprompt analytics requests stats
Adoption
The Usage tab also measures adoption rather than raw traffic:
- Weekly active users (WAU) with period-over-period deltas.
- Requests per user per day — the intensity metric: is usage broad and shallow, or concentrated?
- Top users — a leaderboard of the heaviest users in the period.
Code tab: productivity proxies
The Code tab reports what Claude Code sessions produce. These metrics are proxies, and are labelled as such in the UI — they indicate direction, not ground truth:
- AI-authored lines of code — LOC written by the model in observed sessions.
- Applied edits — edits the model proposed that were applied.
- Permission-grant rate — how often users approve the tool actions the model requests; a rough trust signal.
- Commit lines — lines landing in commits observed through Claude Code sessions, deduplicated and rolled up daily beside AI usage.
Two limits are worth stating plainly:
- Tab-acceptance rate is not measurable. Claude Code emits no accept/reject signal for completions, and no manual-LOC baseline exists, so a true acceptance metric would require an IDE-level integration that does not exist today.
- Commits made outside Claude Code are invisible. Full commit analytics require nominating an authoritative SCM and an identity mapping into it.
Both limitations have their canonical home on the Enterprise Roadmap.
Verified evidence
Every capability on this page is proven by tagged end-to-end tests run against a seeded instance. To replicate: just start, then just e2e-seed --reset, then the command in the table. Screenshots regenerate with just e2e-screens.
| Ref | Verified behaviour | Replicate with |
|---|---|---|
| REQ-003 | The dashboard shows request volume, error rate, active users, and daily/weekly trends across selectable periods | just e2e-req REQ-003 |
| REQ-005 | WAU with deltas, requests/user/day, and the top-user leaderboard, per project | just e2e-req REQ-005 |
| REQ-007 | The Code tab reports AI-authored LOC, applied edits, permission-grant rate, and commit lines, labelled as proxies | just e2e-req REQ-007 |
| REQ-008 | Commits observed through Claude Code sessions are deduplicated, rolled up daily, and plotted beside AI usage | just e2e-req REQ-008 |
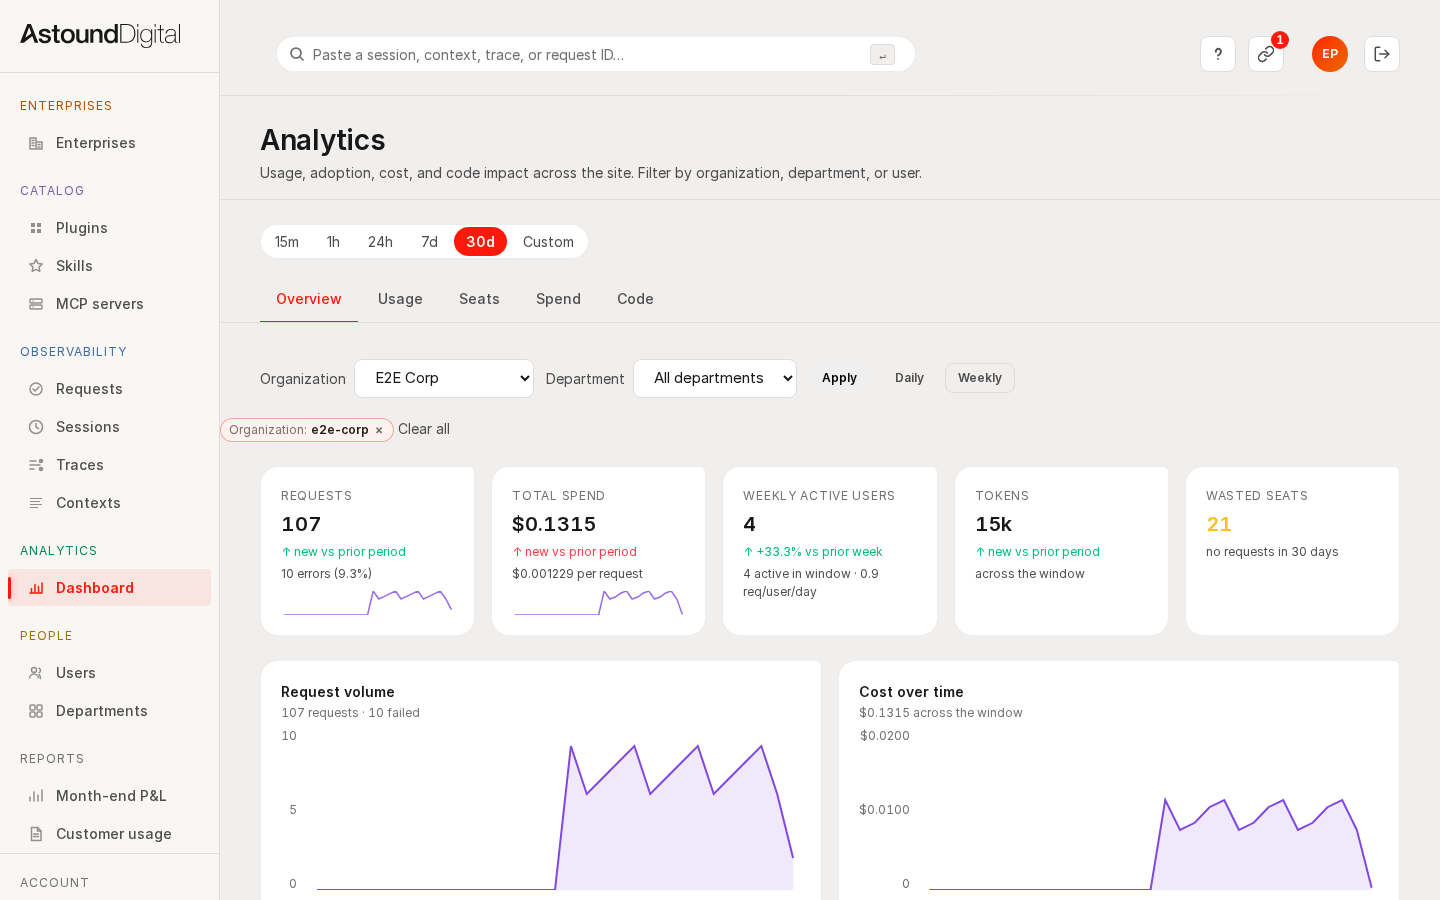 The Overview tab: request volume, error rate, and active users for the selected period.
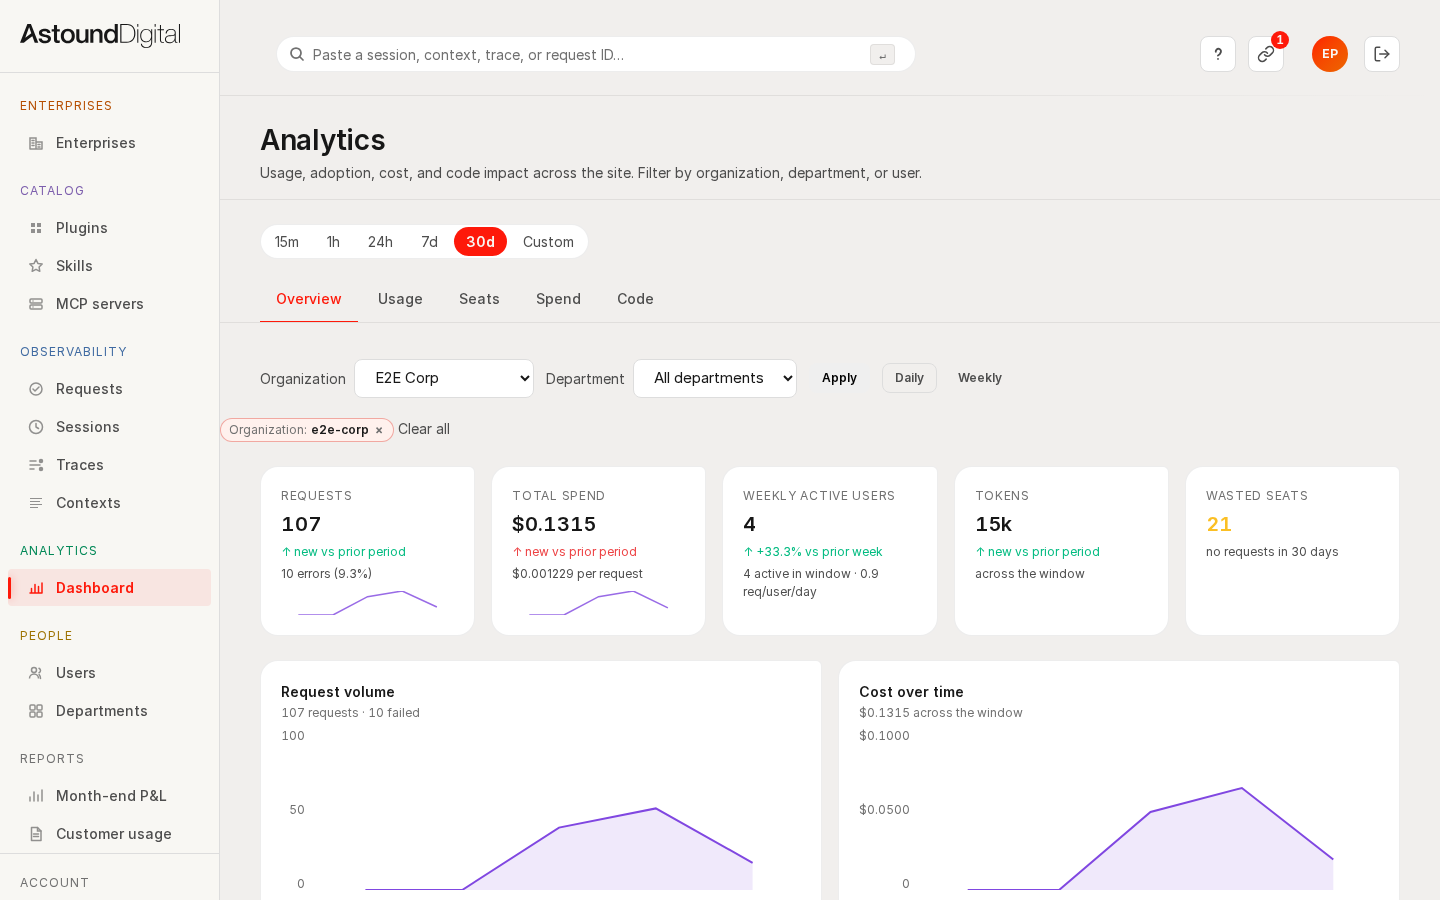 Daily/weekly usage trends with the period selector.
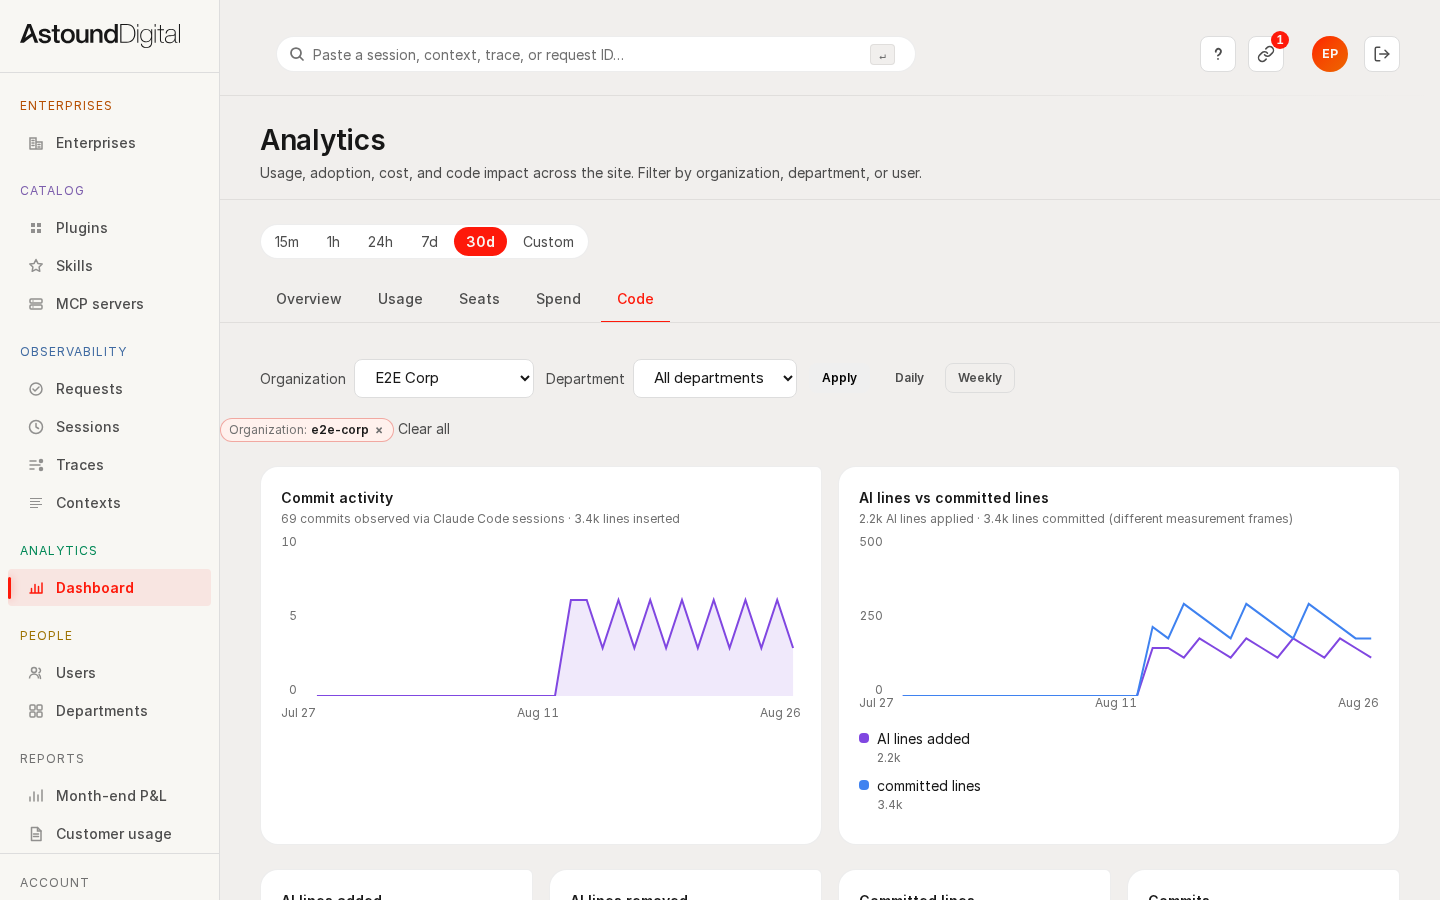 The Code tab: AI-authored LOC, applied edits, permission-grant rate, and commit lines.