Audit Trail, Traceability & Observability
Audit every AI call with actor, cost, and latency; follow one trace id from request to tool to cost; ingest OTLP; and catch cost or error spikes automatically.
On this page
TL;DR: Every model call writes an audit row — actor, model, provider, tokens, cost, latency, trace ids — browsable at /admin/entities/requests. One trace id links the whole chain (request → policy decision → model call → tool execution → cost) and resolves at /admin/entities/traces. The platform ingests OTLP, streams live audit events over SSE, and a persisted anomaly job alerts Slack on cost, volume, and error spikes.
Per-call audit: /admin/entities/requests
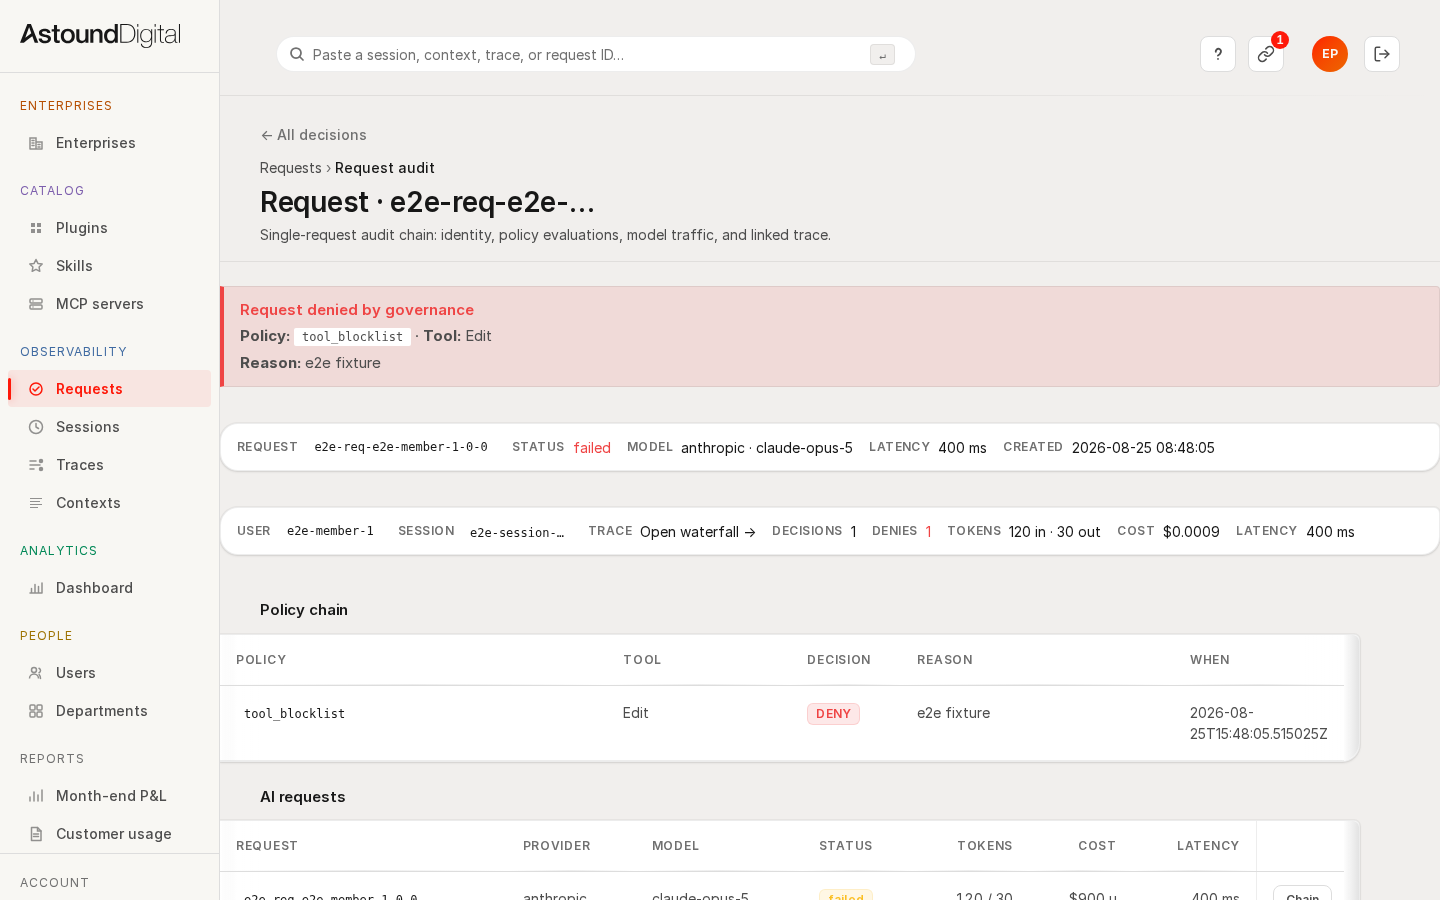
Every request through the gateway lands a row with DB-locked actor attribution: who made the call, which model and provider served it, token counts in and out, cost, latency, status, and the trace ids that link it onward. /admin/entities/requests lists and filters these rows; the CLI reaches the same data:
systemprompt infra logs request list --limit 20
systemprompt infra logs request list --since 1h --provider anthropic
systemprompt infra logs audit <request-id>
audit <request-id> reconstructs the full context for one call — identity, policy evaluations, prompt, response, and cost.
End-to-end traceability: /admin/entities/traces
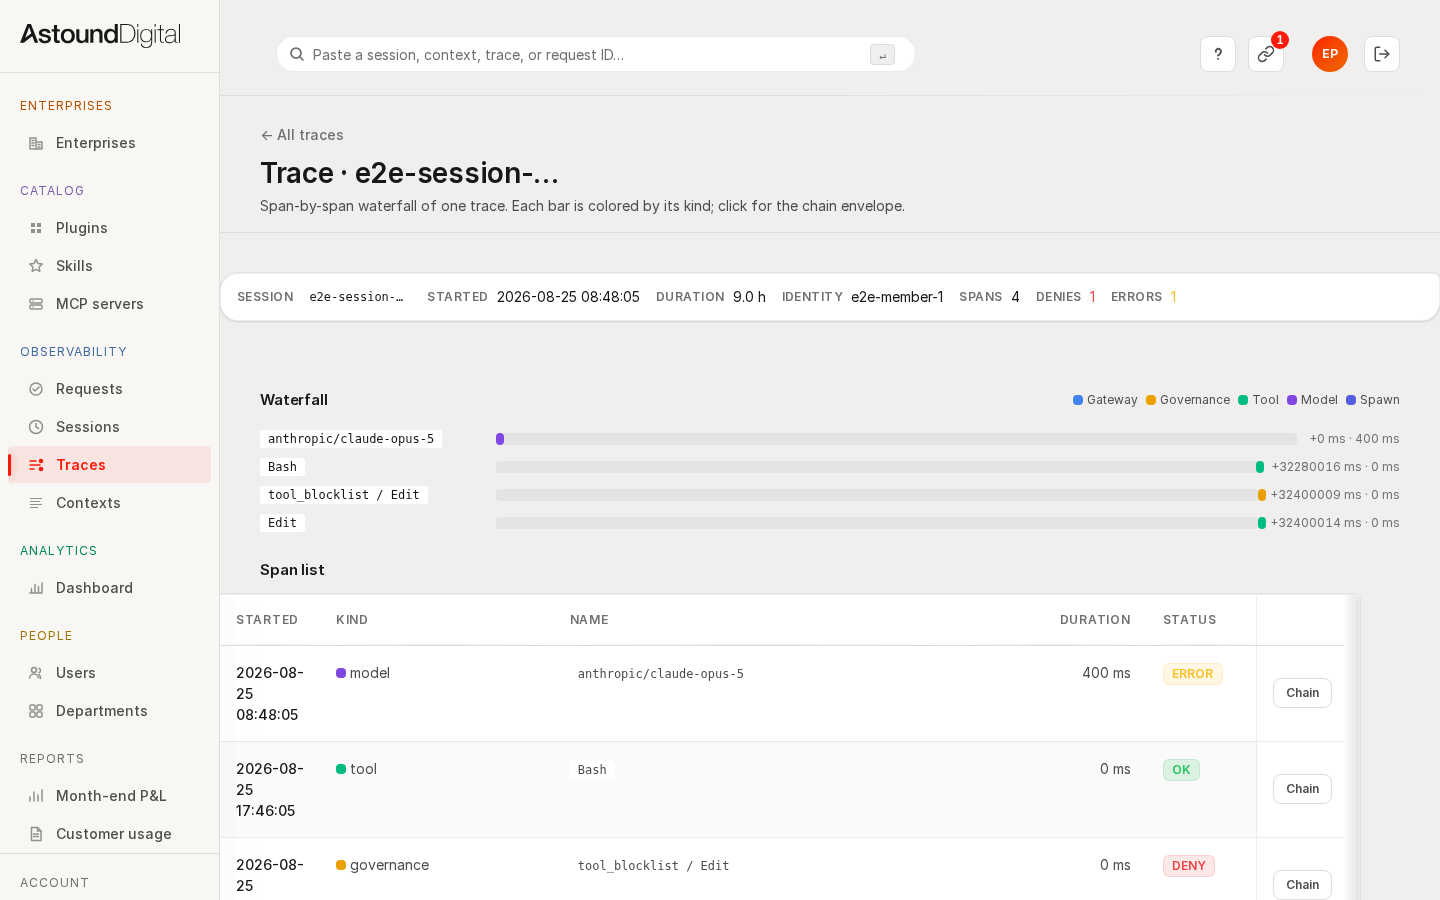
One trace id correlates the entire chain: the inbound request, the governance policy decision, the model call, any MCP or tool executions it triggered, and the resulting cost. /admin/entities/traces is the universal chain resolver — paste a trace id and read the whole story, whichever link you started from.
systemprompt infra logs trace list --limit 20
systemprompt infra logs trace list --agent <name> --status failed
systemprompt infra logs trace show <trace-id>
Observability ingest and live stream
- OTLP ingest — the platform accepts OpenTelemetry traces, logs, and metrics, so instrumented clients and services report into the same place.
- Live audit stream — audit events stream as JSON over Server-Sent Events, useful for watching an incident unfold or feeding a live wallboard.
Anomaly detection
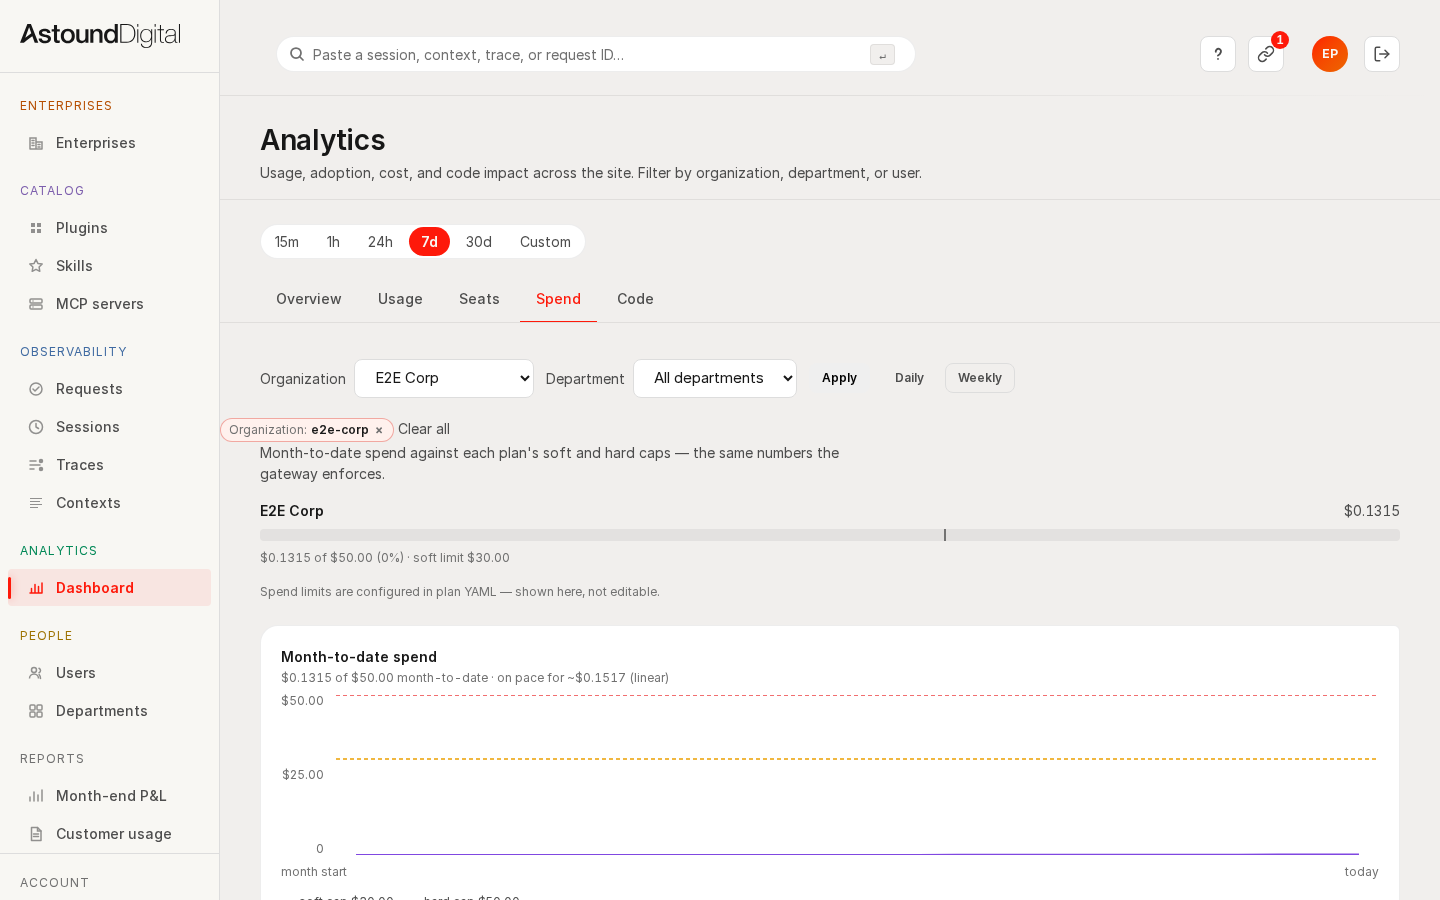
A persisted anomaly job watches for cost spikes, volume spikes, and error spikes against recent baselines. Detections raise a Slack alert and surface on the dashboard. The current detectors are threshold-based rather than learned baselines; tuning iterates with real traffic.
Known caveats
Two limitations are stated here once and tracked on the Enterprise Roadmap:
- Append-only by convention, not mechanism. Audit rows are never updated or deleted in practice, but there is no WORM storage or hash-chaining proving it cryptographically.
- No push egress. Telemetry flows in (OTLP ingest, SSE out to connected clients), but there is no built-in exporter pushing audit data to Datadog, Splunk, or an external OTEL collector.
Verified evidence
Every capability on this page is proven by tagged end-to-end tests run against a seeded instance. To replicate: just start, then just e2e-seed --reset, then the command in the table. Screenshots regenerate with just e2e-screens.
| Ref | Verified behaviour | Replicate with |
|---|---|---|
| REQ-026 | Every model call lands an audit row with actor, model, provider, tokens, cost, latency, and trace ids | just e2e-req REQ-026 |
| REQ-027 | One trace id resolves the full chain: request → policy decision → model call → tool execution → cost | just e2e-req REQ-027 |
| REQ-028 | OTLP telemetry is ingested and audit events stream live over SSE | just e2e-req REQ-028 |
| REQ-031 | An induced cost/volume/error spike is detected by the anomaly job and raises a Slack alert | just e2e-req REQ-031 |
Deeper gateway-level checks for these behaviours also run in the platform's integration suite (just test-integration).
Screenshots