Cost Management, Budgets & FinOps
Attribute every AI request to a user, org, and model; set soft alerts and hard monthly caps; forecast overruns; export CSV reports and schedule Slack digests.
On this page
TL;DR: Every AI request lands with its cost attributed to a user, project, model, and provider. The gateway's quota windows clamp spend per user and per day for the whole instance, refusing with HTTP 429 once a window is spent. The Spend tab shows totals, trends and the cost-by-model split, filterable by project; reports export as CSV from the web and CLI.
Per-request attribution
Cost tracking is not a rollup bolted on afterwards: each request row carries user, model, provider, tokens, and cost (stored as microdollar integers end to end), and every user carries the project — Commerce or Core — the directory placed them in. Dashboards and reports slice on all of these dimensions in near real time, so chargeback to a project is a filter, not a reconciliation project.
systemprompt analytics costs summary
systemprompt infra logs request list --limit 20
The Spend tab
/admin/analytics includes a Spend tab showing:
- Total spend and daily cost trend for the selected period, with cost per request and token counters.
- Model distribution and cost-by-model series — where the money actually goes.
- Project selector — every figure on the tab narrows to Commerce or Core.
Spend clamps
Spend ceilings are the gateway's quota windows (services/gateway/policies.yaml): a per-user hourly window sized as a runaway backstop, and an instance-wide daily window. Once a window is spent, further requests are refused with HTTP 429 and a retry-after, and traffic resumes when the window rolls over. Ceilings are enforced one request late by design — a request's cost is known after its response.
Per-project budgets are not yet available — see the roadmap.
Self-service reporting
- CLI — cost reports accept
--since/--untiland export CSV. Start fromsystemprompt analytics costs summaryandsystemprompt analytics --help. - Web — the admin UI exposes CSV export endpoints for usage and request reports, narrowed to the project you select.
Provider and model cost comparison
An internal report (also reachable from the CLI) breaks cost and margin down by provider and by model, so you can see what a switch of route would save. Quality-normalized comparison ("is the cheaper model good enough?") requires a quality baseline for your workloads — see the roadmap.
Verified evidence
Every capability on this page is proven by tagged end-to-end tests run against a seeded instance. To replicate: just start, then just e2e-seed --reset, then the command in the table. Screenshots regenerate with just e2e-screens.
| Ref | Verified behaviour | Replicate with |
|---|---|---|
| REQ-004 | The Spend tab shows total spend, daily trend, cost/request, token counters, and cost-by-model distribution | just e2e-req REQ-004 |
| REQ-009 | The hard monthly cap returns 429 at the gateway; the soft threshold records and Slack-alerts on first crossing | just e2e-req REQ-009 |
| REQ-010 | Every request row carries user, model, provider, and cost; every user carries a project; reports slice on all of them | just e2e-req REQ-010 |
| REQ-011 | The month-end projection fires a projected-overrun alert on its first crossing per org per month | just e2e-req REQ-011 |
| REQ-012 | The soft threshold alerts once per transition and never blocks a request | just e2e-req REQ-012 |
| REQ-013 | Requests over the org's monthly cap are refused with 429 + retry-after and resume at the month boundary | just e2e-req REQ-013 |
| REQ-014 | The burn-up chart pairs actual spend with the linear month-end projection against the cap | just e2e-req REQ-014 |
| REQ-015 | Cost reports export as CSV from both the CLI (--since/--until) and the admin web UI, org-scoped |
just e2e-req REQ-015 |
| REQ-016 | The scheduled digest job delivers weekly/monthly cost and budget-utilization summaries to Slack | just e2e-req REQ-016 |
| REQ-017 | The comparison report breaks cost down by provider and by model | just e2e-req REQ-017 |
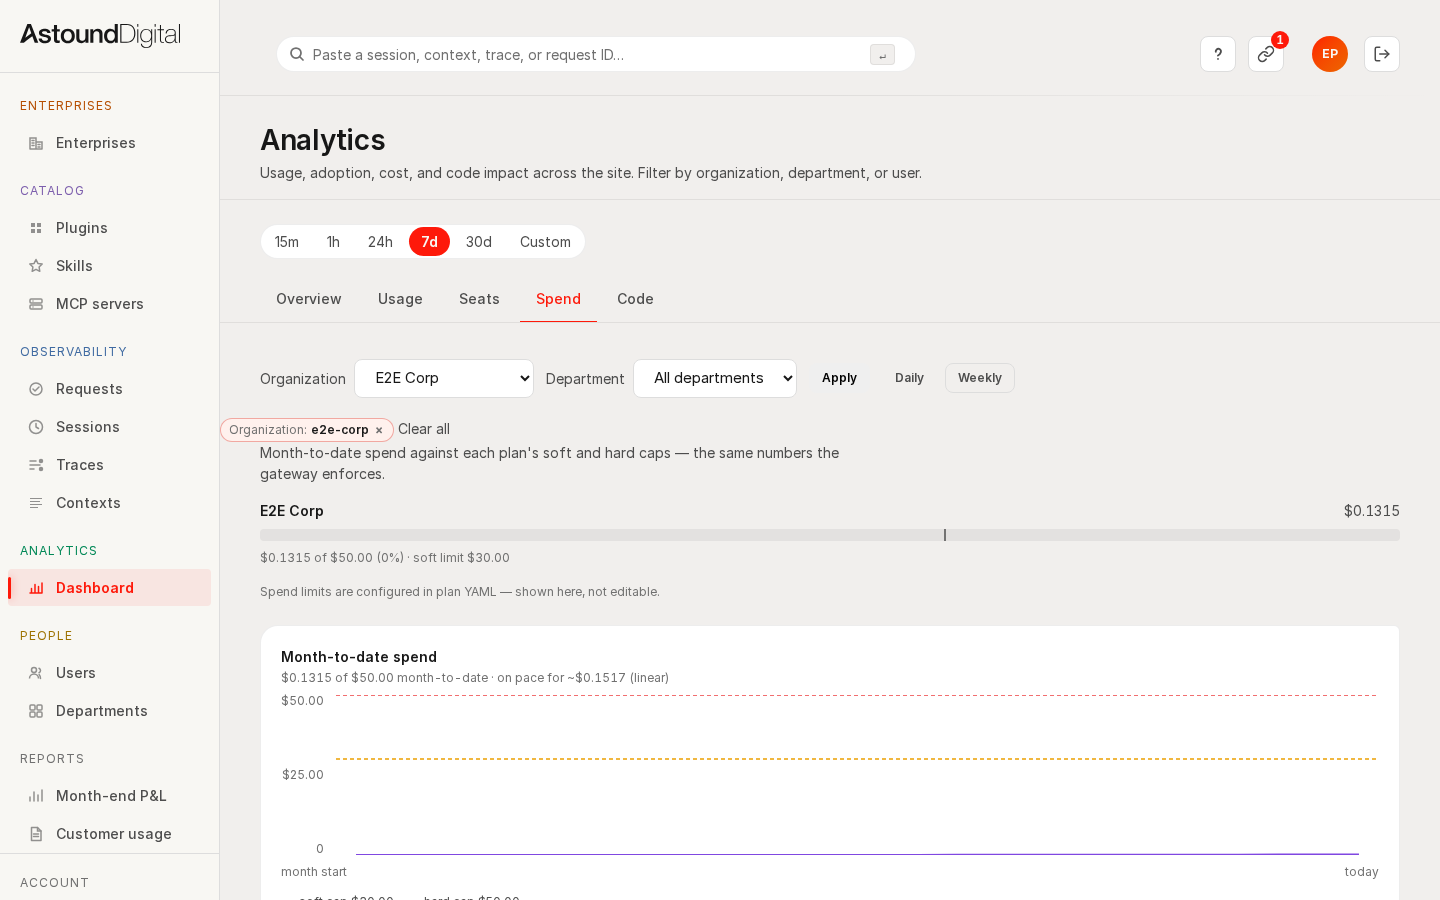 The Spend tab: total spend, daily cost trend, and cost per request.
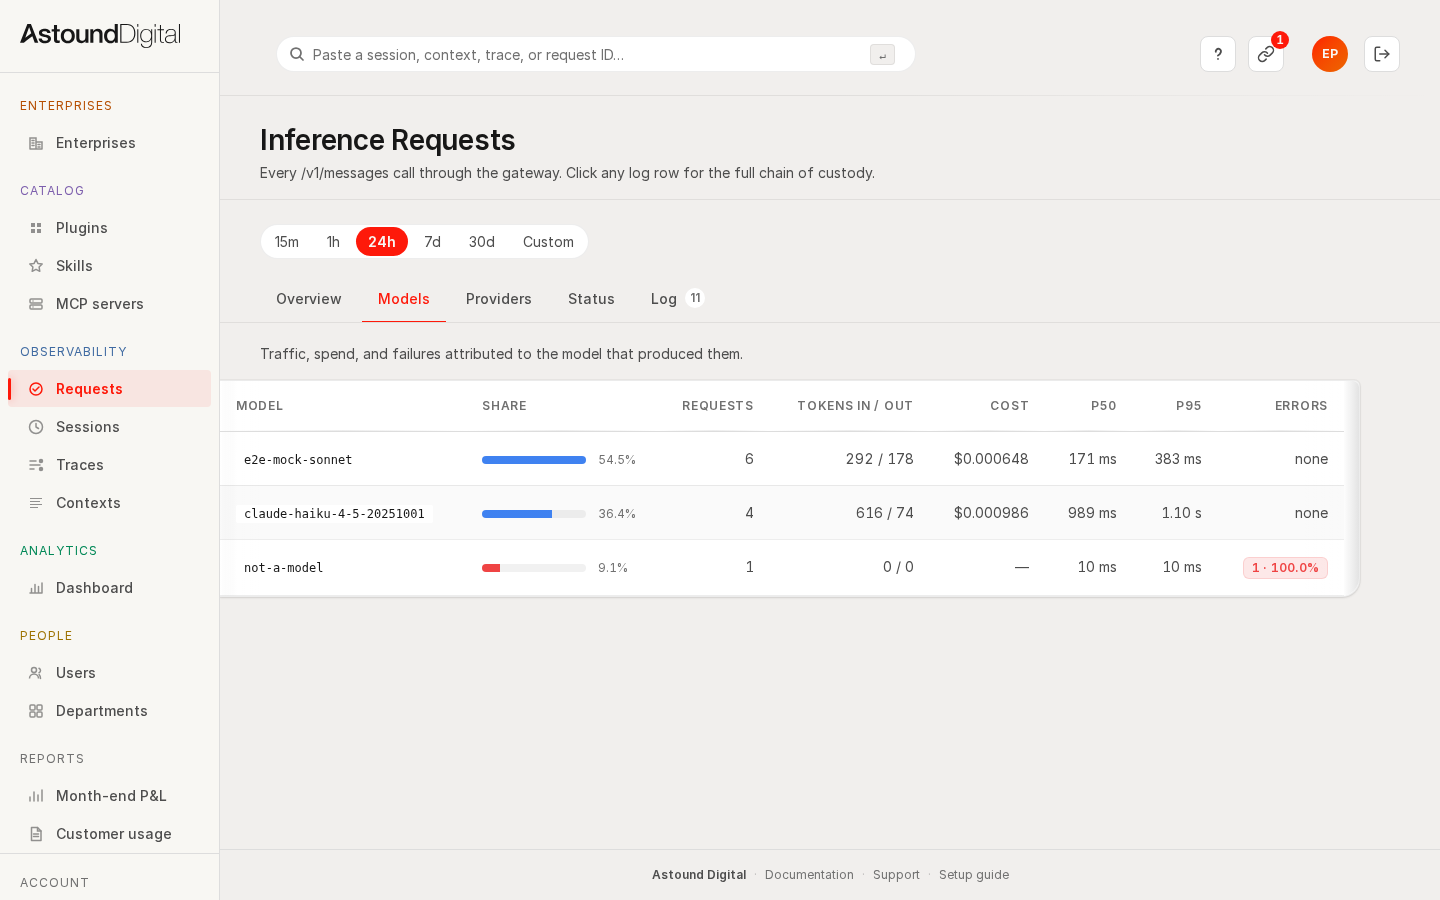 The model mix: where spend actually lands, by model.
Deeper gateway-level checks for these behaviours also run in the platform's integration suite (just test-integration).